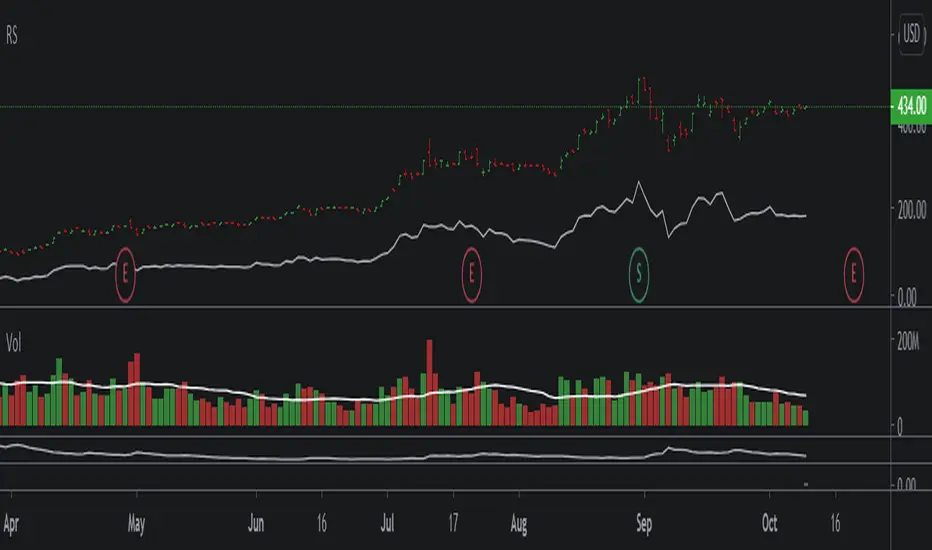
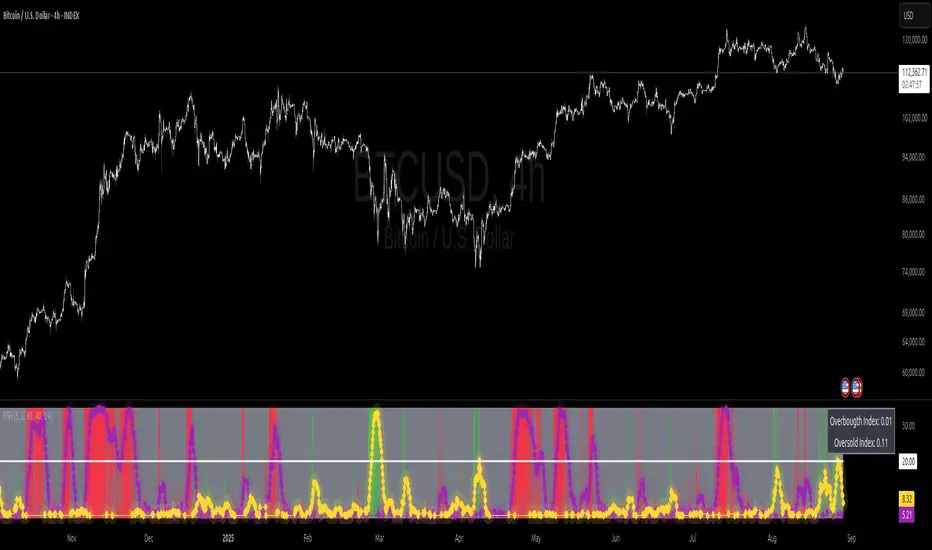
Relative Strength Market PickerModified to code from @modhelius and added colors and histogram for easy reading...thanks to him...
What is Relative Strength?
Relative strength is a ratio of a stock price performance to a market average (index) performance. It is used in technical analysis.
It is not to be confused with relative strength index.
To calculate the relative strength of a particular stock, divide the percentage change over some time period by the percentage change of a particular index over the same time period.
How to read this indicator for trading and decesion making?
There are four colors
Aqua: Shows the bullish momentum against the index of your choosing
Navy blue: Show the bearish momentum is weakning at the time period
Fuschsia : Shows the bullish gaining strength and about to cross zero line
Red: Shows the bearish momentum is strong.
Other indicators to be used along with this are
1. Pivot points
2. Moving Average of highs and lows -- 17 period
To take long calls --- There has to be high closing candle above the 17 period moving average of highs and there has to be bullish momentum and ideally with the pivot point as a support
To take short calls -- There has to low closing candle below the 17 period moving average of lows and there has to be bearish momentum and ideally with the pivot point as a resistance.
In den Scripts nach "relative strength" suchen
Relative Strength Line by QuantxThe Relative Strength Line compares the price performance of a stock against a benchmark index (e.g., NIFTY, S&P 500, Bank Nifty, etc.).
It does not indicate momentum of the stock itself — it indicates whether the stock is outperforming or underperforming the market.
🔍 How To Read It
RSL Behavior Meaning
RSL moving up Stock is outperforming the benchmark (strong leadership)
RSL moving down Stock is underperforming the benchmark (weakness vs market)
RSL breaking above previous highs Strong institutional demand, leadership candidate
RSL trending sideways Stock is performing similar to the index (no leadership)
📈 Why It Matters
Institutional traders and top-performing strategies focus on stocks showing relative strength BEFORE price breakout.
A stock making new RSL highs even before a price breakout often becomes a top performer in the coming trend.
🧠 Core Trading Edge
You don’t need to predict the market.
Just identify which stocks are being accumulated and leading the market right now — that’s what the Relative Strength Line reveals.

Relative Strength Range RankRelative Strength Range Rank – Chart Asset vs. Benchmarks
Description:
This indicator calculates and ranks the relative strength position of the current chart’s asset against up to five user-defined comparison symbols. By default, the comparison set is USDT.D, USDC.D and DAI.D.
Calculation method:
The same oscillator calculation is applied identically to the current chart’s asset and all comparison symbols:
For each symbol:
Determine the lowest low over LOWEST bars.
Determine the highest high over HIGHEST bars.
Calculate normalized position within range:
raw_osc = (close - lowest_low) / (highest_high - lowest_low) * 100
Apply a 10-period EMA to smooth raw_osc.
Invert and scale to match assets direction:
raw_osc = 100 - EMA_10(raw_osc)
Apply weighted smoothing:
smoothed = 0.191 * previous_value + 0.809 * current_value
Apply a final 1-period EMA to reduce jitter.
Output is the inverted smoothed oscillator value, representing the relative strength rank.
This function is implemented as calculate_oscillator() and used for all input symbols plus the current chart symbol, ensuring consistency in comparative analysis.
Plotting:
Each comparison symbol oscillator is plotted in the indicator pane.
The current chart oscillator is always plotted in black.
Alert condition:
Boolean chart_osc_above_all is true when the current chart oscillator is strictly greater than all other comparison oscillator values.
The alert chart_osc_crossed_above triggers only on the first bar where chart_osc_above_all changes from false to true.
Smoothing advantage:
The smoothing sequence (EMA → weighted smoothing → EMA) is designed to reduce short-term noise while preserving responsiveness to changes in price position.
The initial EMA(10) filters random fluctuations.
The weighted smoothing step (0.191 * prev + 0.809 * current) reduces overshoot and dampens oscillations without introducing significant lag, unlike longer EMAs.
The final EMA(1) step ensures stability in the plotted oscillator without visible jaggedness.
This combination yields a signal that is both smooth and reactive, making relative strength comparisons more precise.
Inputs:
Sym 1–5: up to five comparison tickers.
Lowest low lookback period ( LOWEST ).
Highest high lookback period ( HIGHEST ).
Color for plotted comparison lines.
Output:
Oscillator values from 0 to 100, where higher values indicate that the asset’s current price is closer to the highest high of the lookback period, and lower values indicate proximity to the lowest low.
Sorted table showing all selected assets ranked by oscillator value.
Optional alert when the current chart asset leads all selected assets in oscillator value.
Short Description:
Computes range-normalized oscillator values for the chart asset and up to 5 symbols, using EMA and weighted smoothing to reduce noise while preserving responsiveness; optional alert when the chart asset exceeds all others.

Relative Strength MatrixThe Relative Strength Matrix (RSPS M) is a powerful comparison tool that analyzes and ranks up to 10 selected assets based on their relative performance. It does this by calculating price ratios between all asset pairs and applying a consistent strength criterion across each comparison. The results are displayed in a live-updating matrix, showing how each asset performs relative to the rest of the group.
By default, the indicator uses a momentum-based approach (via RSI) to evaluate strength, but it’s fully customizable. Users can modify the valuation logic by replacing the built-in ta.rsi function under the “Inputs your criterion below” section in the code. This makes the tool highly flexible—allowing for different styles of comparison such as trend-following, volatility-adjusted, or custom factor-based ranking methods.
Each asset’s total dominance score is color-coded and ranked, making it easy to spot outperformers and underperformers within any chosen basket. Whether you're tracking crypto pairs, sectors, or other groups, RSPS M provides a clear, objective framework for relative strength monitoring and rotation strategies—perfect for spotting leaders, laggards, and shifts in momentum across markets.
Relative Strength Index With Range ZoneRSI (Relative Strength Index) with 45-55 Range Zone
1. Introduction and Historical Background
The Relative Strength Index (RSI) is a momentum indicator developed in 1978 by J. Welles Wilder Jr. It measures the speed and magnitude of price changes to assess overbought and oversold conditions of an asset. This widely used oscillator ranges between 0 and 100.
Historically, the RSI was mainly used to detect trend reversals by identifying extreme levels: above 70 (overbought) and below 30 (oversold). However, its application has evolved, and new approaches refine its interpretation, such as adding a 45-55 neutral zone to identify consolidation (range) periods.
2. RSI Calculation
The RSI is calculated using the following formula:
RSI=100−(1001+RS)RSI=100−(1+RS100)
Where:
RS=Average gain over N periodsAverage loss over N periodsRS=Average loss over N periodsAverage gain over N periods
• RS (Relative Strength) is the ratio between the average gains and the average losses over N periods (typically 14 periods).
• Gains and losses are calculated based on daily price variations.
Example calculation with a 14-day period:
1. Compute daily gains and losses.
2. Take an exponential or simple moving average of these values over 14 days.
3. Apply the formula to get the RSI value.
3. Classic RSI Usage
The RSI is typically interpreted as follows:
• RSI > 70: Overbought → Possible correction or bearish reversal.
• RSI < 30: Oversold → Possible rebound or bullish reversal.
• RSI between 50 and 70: Bullish momentum.
• RSI between 30 and 50: Bearish momentum.
4. Adding the 45-55 Zone to Identify Range Phases
Adding a neutral zone between 45 and 55 helps identify consolidation periods, when price moves sideways without a strong trend.
• RSI between 45 and 55: The market is in a range, meaning neither buyers nor sellers dominate.
• RSI breaking out of this zone:
o Above 55: Indicates the start of a bullish trend.
o Below 45: Indicates the start of a bearish trend.
This zone is particularly useful for:
• Avoiding false signals by waiting for trend confirmation.
• Identifying ranging markets, favoring range trading strategies (buying at support, selling at resistance).
• Filtering trend-based entries, waiting for the RSI to exit the 45-55 zone.
5. Trading Strategies Using RSI with the 45-55 Range Zone
1. Range Trading:
• When the RSI oscillates between 45 and 55, it signals a lack of strong trend.
• Strategy:
o Identify a support and resistance level.
o Buy near support when the RSI touches 45.
o Sell near resistance when the RSI touches 55.
2. Breakout Trading:
• If the RSI exits the 45-55 zone:
o Above 55 → Buy (start of a bullish trend).
o Below 45 → Sell (start of a bearish trend).
• This breakout can be used as a confirmed entry signal.
3. Confirmation with Divergences:
• A bullish divergence (price making lower lows while RSI makes higher lows) is more relevant if the RSI moves above 55.
• A bearish divergence (price making higher highs while RSI makes lower highs) is stronger if the RSI drops below 45.
6. Conclusion
The RSI is a powerful tool for analyzing price momentum. Adding a 45-55 zone enhances its usage by clearly distinguishing:
• Consolidation phases (range markets).
• Trend beginnings when RSI breaks out of this range.
This approach improves RSI reliability by filtering out false signals and allowing traders to adapt their strategy based on market conditions.

Relative Strength Price Oscillator Indicator (RS PPO)Percentage Price Oscillator (PPO)
The Percentage Price Oscillator (PPO) is a momentum oscillator that measures the difference between two moving averages as a percentage of the larger moving average. As with its cousin, MACD, the Percentage Price Oscillator is shown with a signal line, a histogram and a centerline. Signals are generated with signal line crossovers, centerline crossovers, and divergences.
PPO readings are not subject to the price level of the security and the PPO values for different securities can be compared, regardless of the price of the security.
Relative Strength (RS)
Relative strength is a strategy used in momentum investing and focuses on investing in stocks or other securities that have performed well relative to the market as a whole or to a relevant benchmark.
Chart
In the chart, Microsoft stock (MSFT) is plotted against the VanEck Semiconductor ETF (SMH).
In the example on the left, from the negative values of the RS PPO it can be seen that MSFT, although trending upward, is losing out in negative terms to the SMH etf.
In the example on the right, during a correction phase with a downward price trend, Microsoft held up relatively well compared to the Van Eck Semiconductor etf.

Relative Strength wrt ReferenceThis script evaluates the relative strength of the current symbol with respect to your chosen symbol. At the same time it gives an idea about the trend of the reference symbol.
Under default settings, it evaluates the strength with respect to NIFTY50.
While the value of the bars represents the relative strength, Colors of the bars indicate the relative strength status.
The condition action rules are as follows:
-Bar color blue implies that both the underlying and reference increased.
-Bar color green implies that the underlying increased but reference decreased.
-Bar color purple implies that both the underlying and reference decreased.
-Bar color red implies that the underlying decreased but reference increased.
On the other hand, the background colors indicate the general trend structure in the reference in terms of exponential moving averages and adx.
Green implies strong up trend.
Purple implies sideways to bullish trend.
Blue implies sideways to bearish trend
Red implies existing strong downtrend.
You can change the settings as per your choice.

RS - Relative Strength ScoreRelative strength (RS) is a measure of a stock's price performance relative to the overall market. It is calculated by dividing the stock's price change over a specified period by the market's price change over the same period. A stock with a high RS has outperformed the market, while a stock with a low RS has underperformed. (Stock can any asset that can be compared to a reference index like as Bitcoin, Altcoins etc ...)
Here are some advantages:
- Provides a measure of a stock's performance relative to a benchmark index or sector, allowing for a more accurate comparison of performance.
- Helps identify stocks with strong price momentum that are likely to continue outperforming the market in the short to medium term.
- Allows investors to identify the strongest performers within a particular sector or industry.
- Provides a quantitative and objective measure of a stock's performance, which can help reduce bias in investment decisions.
- Can be used in conjunction with other technical indicators and chart analysis to identify potentially profitable trades.
- Helps investors make more informed decisions by providing a more comprehensive picture of a stock's performance.
How to use it:
- The indicator can be used in daily and weekly timeframes.
- Check, if the default reference index is suited for your asset (Settings) The default is the combination of S&P500+Nasdaq+Dow Jones. For Crypto, it could be TOTAL (ticker for total stock market), for German stocks it could be DAX.
- Decide (settings), if you want to see the RS based on annual calculation (IBD style) or based only for the last quarter
Color coding:
- Red: Stock is performing worse than index (RS < 0)
- Yellow: Stock get momentum, starting to perform better than index (RS > 0)
- Green: Stock is outperforming the index
- Blue: Stock is a shooting star compared to index
- When RS turns positive and stays there, it could be an indication for an outbreak (maybe into a stage 2)
No financial advise. For education purposes only.
Relative Strength vs SPY - real time & multi TF analysisOne of the most requested features for TradingView is the ability to include custom indicators in the stock market scanner. While I am sure this feature is coming soon (seriously TV, PLEASE) I decided to use the amazing template provided by QuantNomad (), but I wanted to allow the user to modify the table a bit better so that a multi time frame analysis approach could be used.
The recommended way to use this indicator is to apply it three times to your chart. For each instance, assign it a plotting location (left, center, right) and choose the timeframe you wish to use for the RS analysis. By default, the relative strength of all 39 pre selected stocks will be compared against SPY, on the 5 min timeframe. I personally like having this chart on the left, then the 4 hour timeframe in the center, and the daily on the right. Not only does this setup allow you to see the relative strength/weakness of 39 stocks in real time (the one on the left), but you have all the information in front of you including how the stock has been performing relative to SPY on the 4H and D charts.
To make it easiest to read, you should disable all visual elements to the chart you are applying this indicator to. By minimizing the chart and putting it by your side, you can see the bigger picture on how all your stocks are behaving relative to the market.
If you wish to change any of the stocks I have pre selected, make sure to save your chart template. Otherwise you would need to do this every time you load the indicator to your chart which would be incredibly time consuming.

Relative Strength (IBD Style)This script is meant to give you a Relative Strength indication of the stock. The goal is to use a similar calculation as used by IBD.
It calculates the performance of the current stock for the last year (most recent quarter is weighted double) and compares it to the performance of a reference index or ticker (default is "SPY").
IBD would give you a value between 0 and 100 because this value is the percentile within all stocks. This is not possible with Pine Script at the moment.
So here you get a Relative Strength value that is >0 if the stock is stronger than the index and <0 if it is weaker than the index.
You can still compare the Relative Strength values between stocks (bigger is better) but you won't know which percentile it is right off the bat.

Relative Strength OverlayThis is the original script to my other Relative Strength indicator (link below) It provides a graphical overlay of the Relative Strength, compared to the QLD, a Nasdaq x2 ETF.
You can not use the value to compare to other stocks or securities, as it is scaled based on the price (so it can be used as an overlay).
If you want a value which you can use to compare with other stocks, please see my other Relative Strength indicator.
Relative Strength Heat [InvestorUnknown]The Relative Strength Heat (RSH) indicator is a relative strength of an asset across multiple RSI periods through a dynamic heatmap and provides smoothed signals for overbought and oversold conditions. The indicator is highly customizable, allowing traders to adjust RSI periods, smoothing methods, and visual settings to suit their trading strategies.
The RSH indicator is particularly useful for identifying momentum shifts and potential reversal points by aggregating RSI data across a range of periods. It presents this data in a visually intuitive heatmap, with color-coded bands indicating overbought (red), oversold (green), or neutral (gray) conditions. Additionally, it includes signal lines for overbought and oversold indices, which can be smoothed using RAW, SMA, or EMA methods, and a table displaying the current index values.
Features
Dynamic RSI Periods: Calculates RSI across 31 periods, starting from a user-defined base period and incrementing by a specified step.
Heatmap Visualization: Displays RSI strength as a color-coded heatmap, with red for overbought, green for oversold, and gray for neutral zones.
Customizable Smoothing: Offers RAW, SMA, or EMA smoothing for overbought and oversold signals.
Signal Lines: Plots scaled overbought (purple) and oversold (yellow) signal lines with a midline for reference.
Information Table: Displays real-time overbought and oversold index values in a table at the top-right of the chart.
User-Friendly Inputs: Allows customization of RSI source, period ranges, smoothing length, and colors.
How It Works
The RSH indicator aggregates RSI calculations across 31 periods, starting from the user-defined Starting Period and incrementing by the Period Increment. For each period, it computes the RSI and determines whether the asset is overbought (RSI > threshold_ob) or oversold (RSI < threshold_os). These states are stored in arrays (ob_array for overbought, os_array for oversold) and used to generate the following outputs:
Heatmap: The indicator plots 31 horizontal bands, each representing an RSI period. The color of each band is determined by the f_col function:
Red if the RSI for that period is overbought (>threshold_ob).
Green if the RSI is oversold (
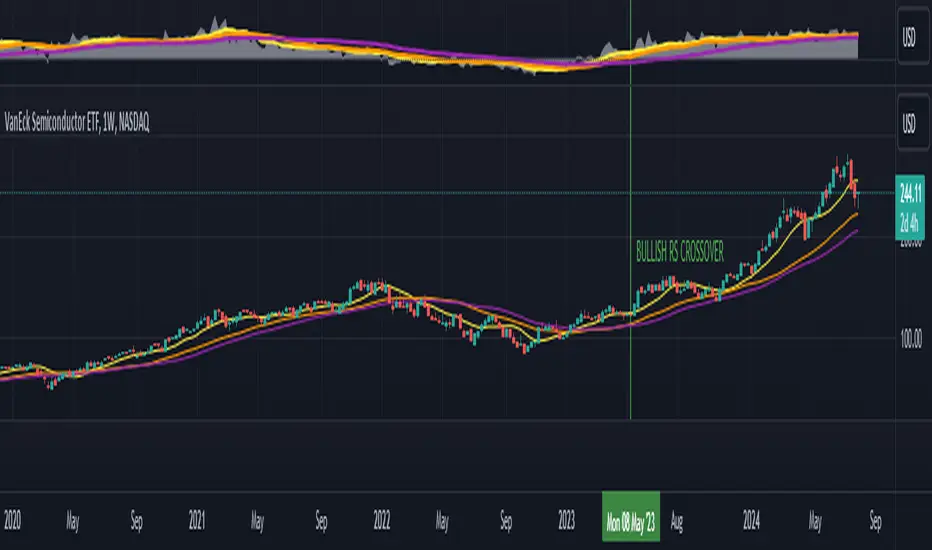
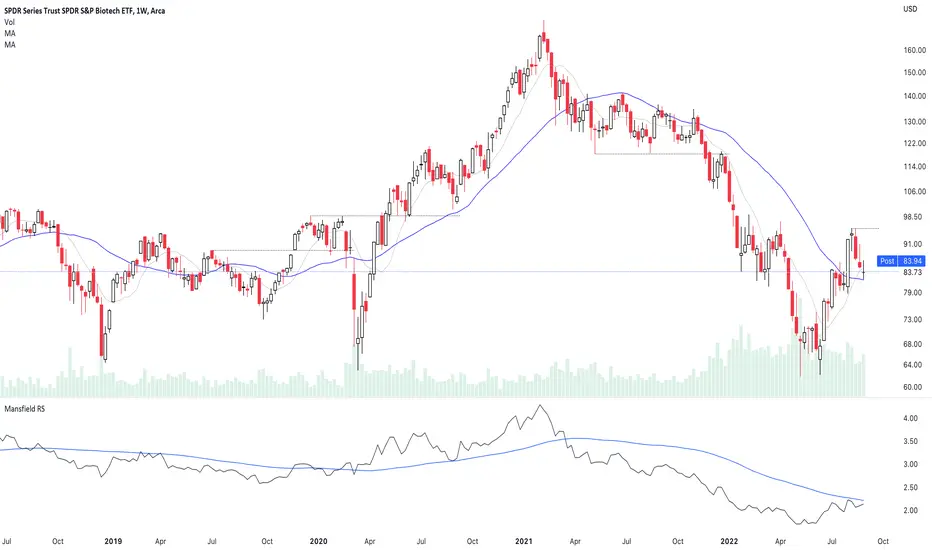
Relative Strength with 3 SMAMansfield RS with 3 SMAs
Overview
The Mansfield Relative Strength (RS) indicator with three Simple Moving Averages (SMAs) enhances traditional RS analysis by adding more clarity and precision to trend identification. This personalized version aims to define RS trends more clearly and end them sooner, helping traders make better-informed decisions.
Key Features
Relative Strength Calculation:
Comparison: Calculates the RS of a chosen symbol against a benchmark (default: S&P 500).
Normalization: Uses the stock’s closing price divided by the closing price of the benchmark over a specified period.
Three SMAs:
Periods: Configurable periods for three SMAs (default: 10, 20, 50).
Trend Smoothing: SMAs help smooth the RS line, making it easier to spot trends and potential reversals.
Visualization:
Area Plot: The RS line is displayed as an area plot.
Color Coding: Different colors for each SMA to distinguish them easily (yellow, orange, purple).
Customization Options:
Comparative Symbol: Choose any benchmark symbol.
Period Adjustment: Customize the periods for both the RS calculation and the SMAs.
Visibility: Option to show or hide the SMAs.
How to Use
Setup:
Add to Chart: Apply the indicator to your TradingView chart.
Customize: Adjust the comparative symbol, RS period, and SMA periods as per your preference.
Interpretation:
Rising RS Line: Indicates the stock is outperforming the benchmark.
Falling RS Line: Suggests underperformance.
SMA Crossovers: Watch for the RS line crossing above or below the SMAs to signal potential buy or sell points.
Trend Direction: SMAs help confirm the trend direction. A rising RS line above the SMAs indicates a strong relative performance.
Trading Strategy:
Trend Confirmation: Use SMA crossovers to confirm trends.
Divergence: Identify divergences between the price action and the RS line for potential reversal signals.
Relative Strength Volume ComparisonThe Relative Strength Volume Comparison is a powerful tool that can help traders identify the current trend based on volume pressure and potential reversals.
This oscillator is made of two lines and the overbought and oversold levels. Each of these two lines is a relative-strength formula that contains both the famous RSI and CCI formulas, smoothed by a Hull moving average.
The two lines are different for input. The colored line is based just on price and changes color based on the relation with the other line. The second line uses as input an average of three different popular volume indicators: The OBV, the Accumulation/Distribution, and the PVT.
Thanks to this tool, which uses 6 different formulas combined, traders can:
- Identify the current trend direction, based on the color of the area fill and the first colored line
- Identify potential reversal areas thanks to the overbought and oversold levels, customizable in the input section alongside the length and smoothing parameters.

Relative Strength against IndexThis is a very simple script to compare the performance of a single stock against its index, by adding / subtracting points for particular price action on up /down - days in the index.
For instance: If the index is down <-1ATR and the stock is not, it's +1 point. If the index is up >1ATR and the stock is up less than half, it's -1 point.
Basic idea (vs the commonly used "relative strength comparison") is that regular relative strength action over a time tells more about accumulaiton than pure price outperformance.
Formula can probably be made better - I'm open to suggestions...

Relative Strength/Zero Line/UP/DOWN(When Relative Strength Cross Over Zero Line with Green Signal then you decide @@Buy posation at own risk reward)
(Whwn Relative Strength Cross zero line Below with red Signal , Then you decide Short posation at own Risk.)

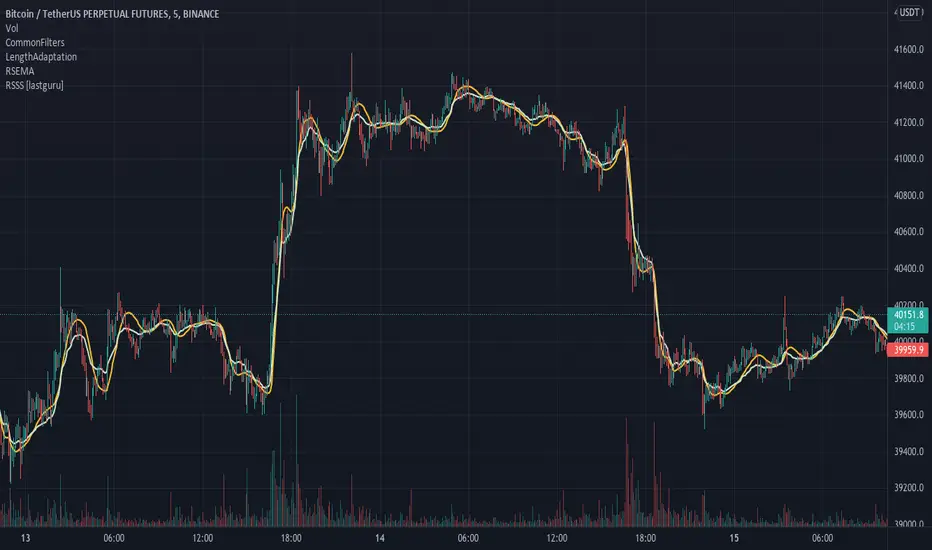
Relative Strength Super Smoother by lastguruA better version of Apirine's RS EMA by using a superior MA: Ehlers Super Smoother.
In January 2022 edition of TASC Vitaly Apirine introduced his Relative Strength Exponential Moving Average. A concept not entirely new, as Tushar Chande used a similar calculation for his VIDYA moving average. Both are based on the idea to change EMA length depending on the absolute RSI value, so the moving average would speed up then RSI is going up or down from the center value (when there is a significant directional price movement), and slow down when RSI returns to the center value (when there is a neutral or sideways movement). That way EMA responsiveness would increase where it matters most, but decrease where there is a high probability of whipsaw.
There are only two main differences between VIDYA and RS EMA:
RSI internal smoothing - VIDYA uses SMA, as Chande's CMO is an RSI with SMA; RS EMA uses EMA
Change direction - VIDYA sets the fastest length; RS EMA sets the slowest length
Both algorithms use EMA as the base of their calculation. As John F. Ehlers has shown in his article "Predictive and Successful Indicators" (January 2014 issue of TASC), EMA is not a very efficient filter, as it introduces a significant lag if sufficient smoothing is required. He describes a new smoothing filter called SuperSmoother, "that sharply attenuates aliasing noise while minimizing filtering lag." In other words, it provides better smoothing with lower lag than EMA.
In this script, I try to get the best of all these approaches and present to you Relative Strength Super Smoother. It uses RS EMA algorithm to calculate the SuperSmoother length. Unlike the original RS EMA algorithm, that has an abstract "multiplier" setting to scale the period variance (without this parameter, RSI would only allow it to speed up twice; Vitaly Apirine sets the multiplier to 10 by default), my implementation has explicit lower bound setting, so you can specify the exact range of calculated length.
Settings:
Lower Bound - fastest SuperSmoother length (when RSI is +100 or -100)
Upper Bound - slowest SuperSmoother length (when RSI is 0)
RSI Length - underlying RSI length. Unlike the original RSI that uses RMA as an internal smoothing algorithm, Vitaly Apirine uses EMA, which is approximately twice as fast (that is needed because he uses a generally long RSI length and RMA would be too slow for this). It is the same as the Upper Bound by default (0), as in the original implementation
The original RS EMA is also shown on the chart for comparison. The default multiplier of 10 for RS EMA means that the fastest EMA period is around 4. I use the fastest period of 8 by default. It does not introduce too much of a lag in comparison, but the curve is much smoother.
This script is just an interface for my public libraries. Check them out for more information.
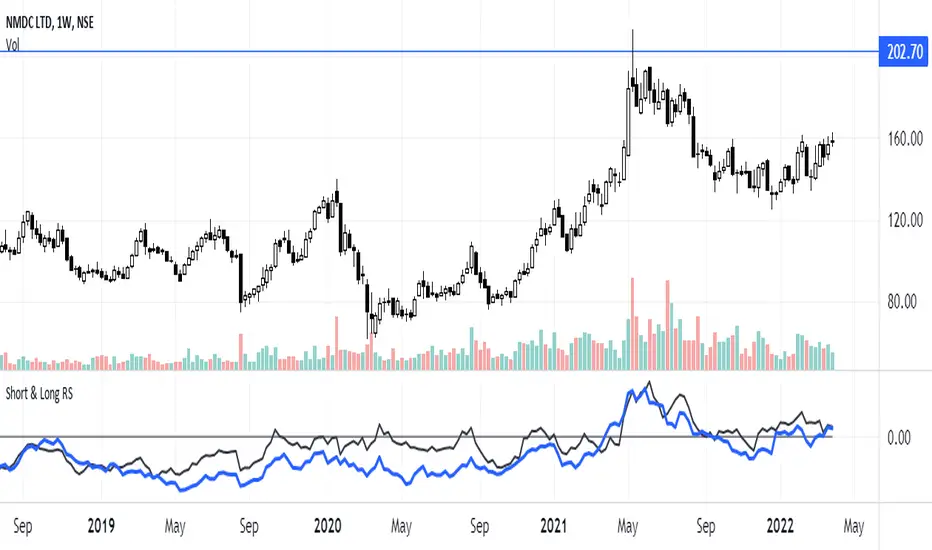
Short & Long Relative StrengthRelative Strength (RS) is a method of identifying stocks which are relatively stronger or weaker as compared the market as a whole or to a relevant benchmark.
To calculate the relative strength of a particular stock, divide the percentage change over some time period by the percentage change of a particular index over the same time period.
The value of RS Indicator oscillates around zero. If value of RS is above ZERO then security is outperforming the benchmark and if value of RS is below ZERO then security is outperforming the benchmark.
Here i have used two RS indicator lines in one indicator - Short Term RS (default value is 65) and Long Term RS (default value is 123).
I have set default benchmark index as Nifty 50 (NSE:NIFTY)
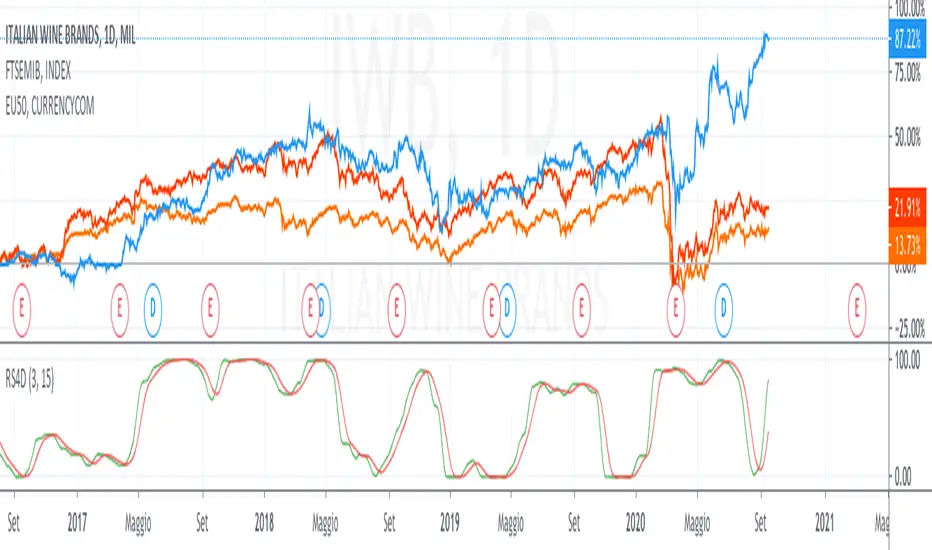
Relative Strength 4DimensionIn the S&C September 2020 article “Tracking Relative Strength In Four Dimensions”, James Garofallou presents a metric for evaluating a security’s strength relative to 11 major market sectors and over several time periods. All this information is squeezed into a single value. Maybe at cost of losing other important information? In this article we’ll look into how to program such a beast, and how it fares when we use it for rebalancing a stock portfolio.
This is a redesigned version for an european point of view.
I used 10 index for the comparison.
feel free to tip me ;-)
Relative Strength (Mansfield RS)This version of the Mansfield Relative Strength Indicator uses the unflattened version of the indicator recommended on the Stage Analysis website, as the slope angle of "Zero Line" (52 week MA of the stock / S&P 500) gives additional useful information that can't be seen on the traditional flattened version of the Mansfield Relative Strength Indicator.
Relative Strength of Volume Indicators by DGTThe Relative Strength Index (RSI) , developed by J. Welles Wilder, is a momentum oscillator that measures the speed and change of price movements.
• Traditionally the RSI is considered overbought when above 70 and may be primed for a trend reversal or corrective pullback in price, and oversold or undervalued condition when below 30. During strong trends, the RSI may remain in overbought or oversold for extended periods.
• Signals can be generated by looking for divergences and failure swings. If underlying prices make a new high or low that isn't confirmed by the RSI, this divergence can signal a price reversal. If the RSI makes a lower high and then follows with a downside move below a previous low, a Top Swing Failure has occurred. If the RSI makes a higher low and then follows with an upside move above a previous high, a Bottom Swing Failure has occurred
• RSI can also be used to identify the general trend. In an uptrend or bull market, the RSI tends to remain in the 40 to 90 range with the 40-50 zone acting as support. During a downtrend or bear market the RSI tends to stay between the 10 to 60 range with the 50-60 zone acting as resistance
This study aim to implement Relative Strength concept on most common Volume indicators, such as
• Accumulation Distribution is a volume based indicator designed to measure underlying supply and demand
• Elder's Force Index (EFI) measures the power behind a price movement using price and volume
• Money Flow Index (MFI) measures buying and selling pressure through analyzing both price and volume (used as it is)
• On Balance Volume (OBV) , created by Joe Granville, is a momentum indicator that measures positive and negative volume flow
• Price Volume Trend (PVT) is a momentum based indicator used to measure money flow
Plotting will be performed for regular RSI and RSI of Volume indicator (RSI(VOLX)) selected from the dialog box, where the possibility to apply smoothing is provided as option. Additionally, labels can be added optionally to display the value and name of selected volume indicator
Secondly, ability to present Volume Histogram within the same study along with its Moving Average or Volume Oscillator based on selection
Finally, Volume Based Colored Bars , a study of Kıvanç Özbilgiç is added to emphasis volume changes on top of the bars
Nothing excessively new, the study combines RSI with;
- RSI concept applied to some of the common Volume indicators presented with a highlighted over/under valued threshold area, optional labeling and smoothing,
- added Volume data with additional information and
- colored bars based on volume
Thanks @Vishant_Meshram for the inspiration 🙏
Disclaimer:
Trading success is all about following your trading strategy and the indicators should fit within your trading strategy, and not to be traded upon solely
The script is for informational and educational purposes only. Use of the script does not constitute professional and/or financial advice. You alone have the sole responsibility of evaluating the script output and risks associated with the use of the script. In exchange for using the script, you agree not to hold dgtrd TradingView user liable for any possible claim for damages arising from any decision you make based on use of the script

Relative Strength LevyDescription:
The concept of Relative Strength to Levy is based on the assumption that, securities which exhibited a large relative strength in the past will also develop relatively strongly in future, and conversely.
It is compare on the performance of the past with the performance of last observation period.
Calculation:
Arithmetic mean of the candle closing price over the observation period.
The result is plotted around the 1.0 mark.
RSL = Close / Moving Average
Interpretation:
If an instrument has an RSL of greater than 1, it is more likely than not, the instrument is more than weak in the past.
Second interpretation of Levy is to first divide the standard deviations of the last 27 weekly closing prices. The intention of this method is to determine the volatility of the securities being observed.

Relative StrengthThis indicator is called Relative Strength and is no way related to RSI ( Relative strength indicator).
It is simply a ratio of asset A to asset B plotted. Usually it is used to look for strength vs a particular index. Since it is a ratio, all the trendlines work on it. The default index is NIFTY. You can change it any index/script you want to compare:
1. Script vs Index
2. Index vs Index
